

Portfolio
Every project’s status, progress, forecast and risk on one screen, for the people who need the whole picture.
Features
Tasks, timelines, people and forecasts share one model, so a change in one place shows up everywhere it matters.
Projects and tasks
Break each project into milestones and tasks with owners, priorities, estimates and due dates. Work in a list or on a board, and let My Work gather each person’s tasks from every project.
To do
Content migration plan
In progress
Checkout redesign
API rate limits
In review
Release notes v2.4
Timeline
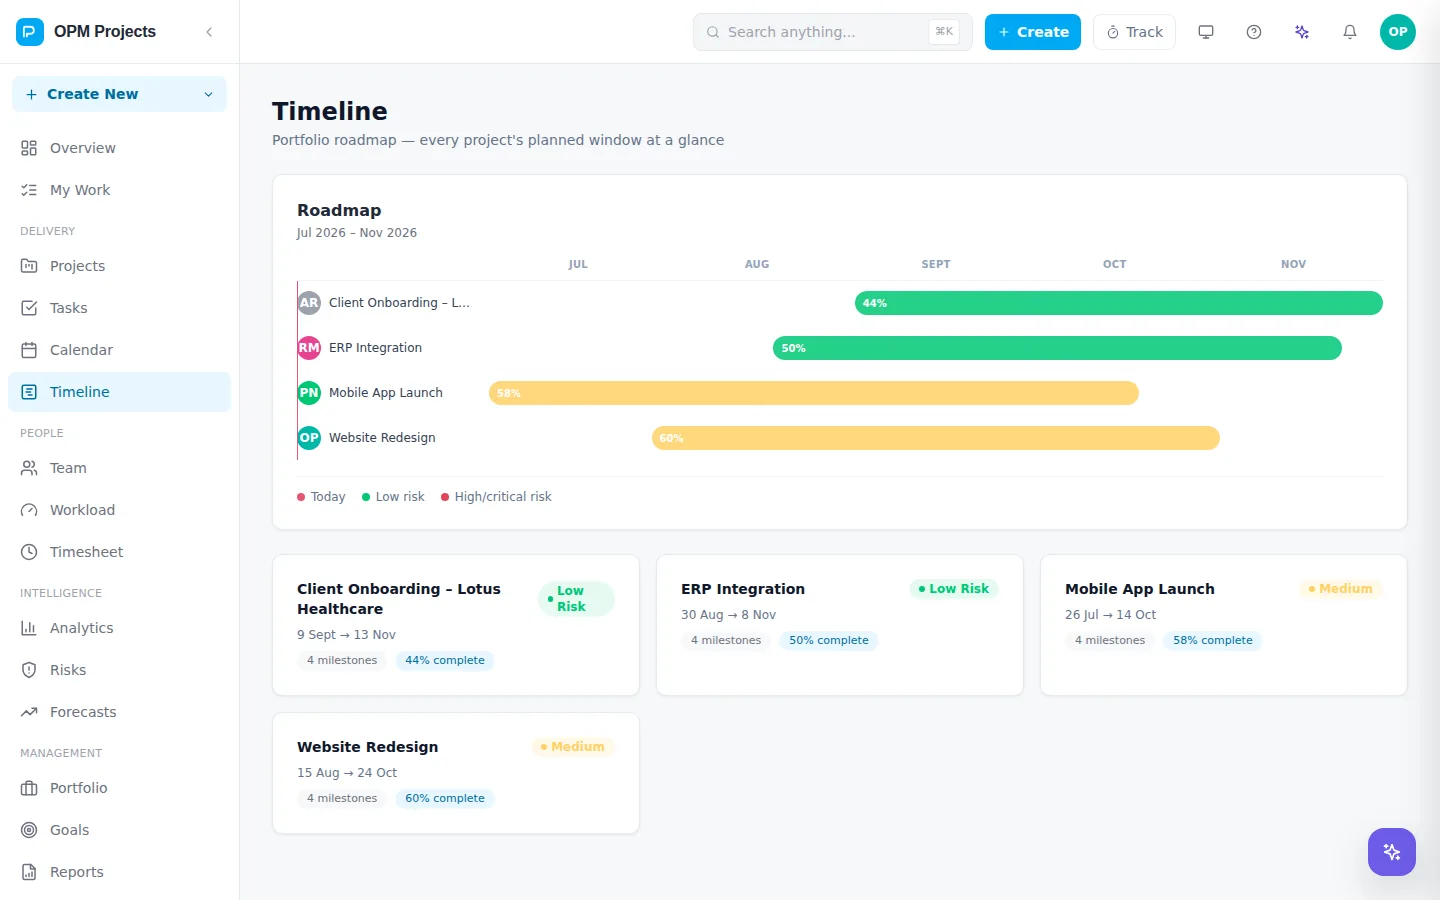
The timeline shows every project’s window, progress and risk. Inside a project, the Gantt chart links tasks with dependencies and marks the critical path.
Workload and time
Workload shows allocation by person and week, with over-capacity weeks flagged. Timesheets record the real effort, which feeds workload, forecasts and reports.

Forecasts
Forecasts run simulations over the remaining work to show a P50 date and a P90 date. What-if scenarios test changes such as more people or less scope before you commit to them.
P50 · likely by
14 Oct
P90 · almost sure by
29 Oct
Risks
Keep a risk register for each project with severity and status, and see health across every project so the ones that need help stand out.

Portfolio and more
Every project’s status, progress, forecast and risk on one screen, for the people who need the whole picture.
Goals tied to the projects that move them.
Throughput, progress and team trends.
Project, time and portfolio reports.
Daily and weekly time entry.
Deadlines and milestones by month.
Rules, with ready-made templates to start from.
Project documents beside the plan.
People, roles and allocation.
Updates on the work you own.
Find any project, task or doc.
Change people, scope or dates in a scenario and compare its forecast with today’s plan before you decide.
Register, severity and status.
The real thing
We will set up a walkthrough around a real plan, your team and your dates.