

OPM Projects
Plan the work. Deliver on the date.
Projects, tasks, timelines and workload in one place, with delivery forecasts that show risk while there is still time to act.

P50 · likely by
14 Oct
P90 · almost sure by
29 Oct
How work flows
From the first plan to the last handover.
Every project follows the same clear path, and everyone can see where it stands.
Plan
Milestones, tasks and dependencies.
Assign
Owners, estimates and capacity.
Deliver
Boards, lists and My Work.
Track
Timesheets and progress.
Forecast
Likely and near-certain dates.
Report
Portfolio, goals and reports.
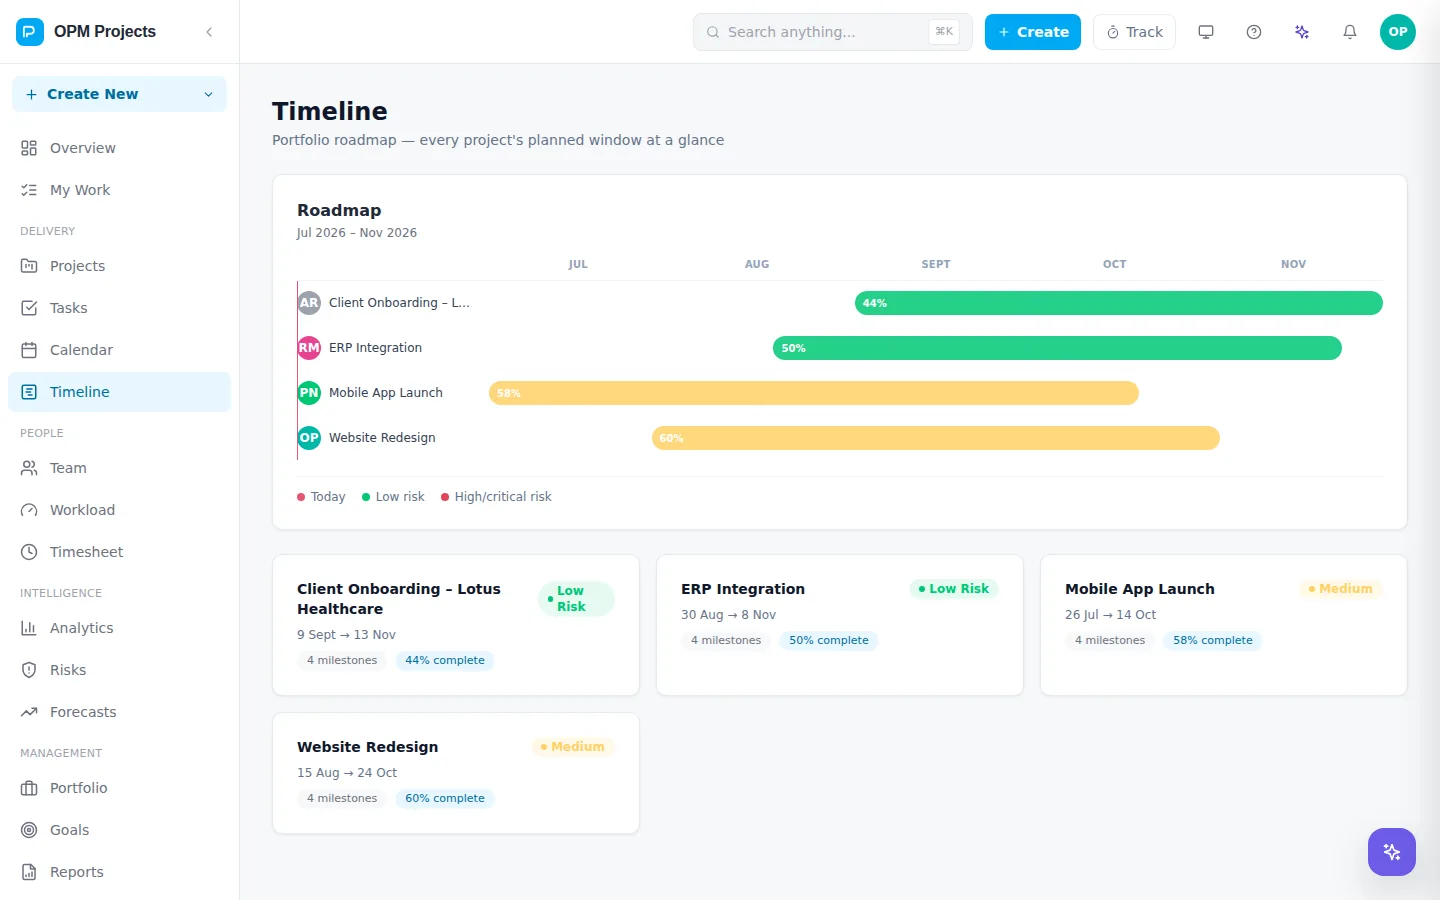
Timeline
Every project’s window, on one roadmap.
See each project’s planned dates, progress and risk side by side. Open a project for its Gantt chart, with dependencies and the critical path marked, so you know which slip moves the finish date.
- Portfolio roadmap across projects
- Gantt with dependencies and critical path
- Milestones on every project

Workload
Protect your team from the week that breaks them.
Workload shows who is over capacity, week by week, before it happens. Rebalance work, and watch burnout signals built from overtime and allocation, so good people stay.
- Capacity by person and week
- Burnout signals
- Timesheets feed real effort back in

Everything in one place
The whole delivery toolkit, already connected.
Tasks
Lists and boards with owners, priorities and due dates.
My Work
Each person’s tasks across every project.
Calendar
Deadlines and milestones on a calendar.
Timesheets
Time logged against tasks.
Risks
A risk register for each project.
Goals
Goals linked to the work that moves them.
Docs
Project documents beside the plan.
Automations
Rules and ready-made automation templates.
Forecasts
A delivery date you can say out loud.
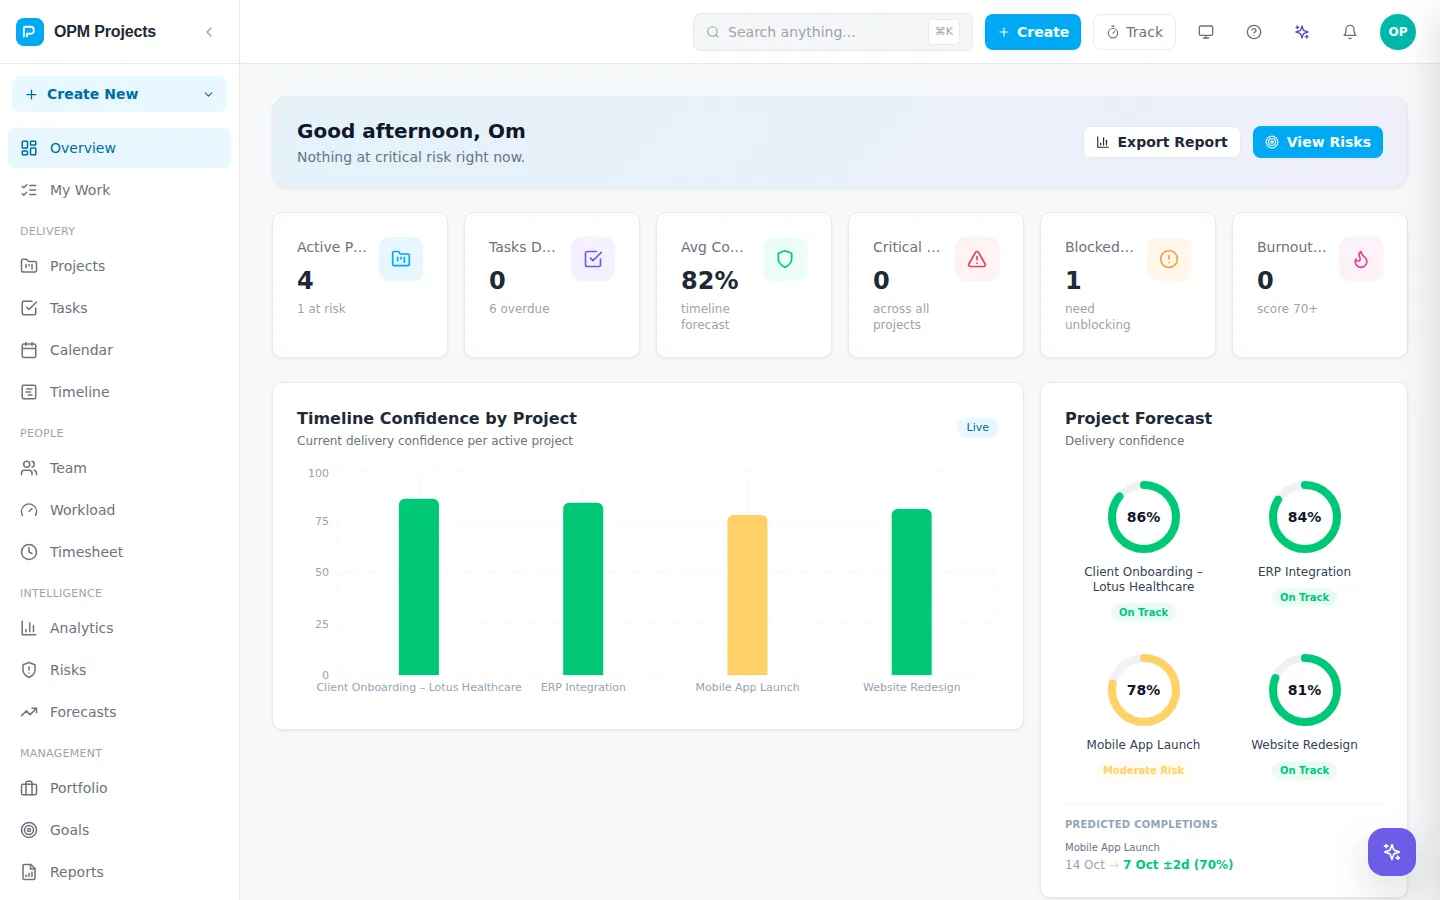
Forecasts simulate the remaining work many times, using your team’s real pace, to give a likely date and a near-certain one. Try a what-if, such as adding a person or cutting scope, and see the dates move before you commit.
- P50 and P90 delivery dates
- What-if scenarios
- Risk and health across projects
P50 · likely by
14 Oct
P90 · almost sure by
29 Oct
Inside OPM Projects
The screens your team will live in.
The portfolio roadmap
Every project’s planned window, progress and risk at a glance.
- Roadmap across projects
- Risk colour on every bar
- Milestones per project
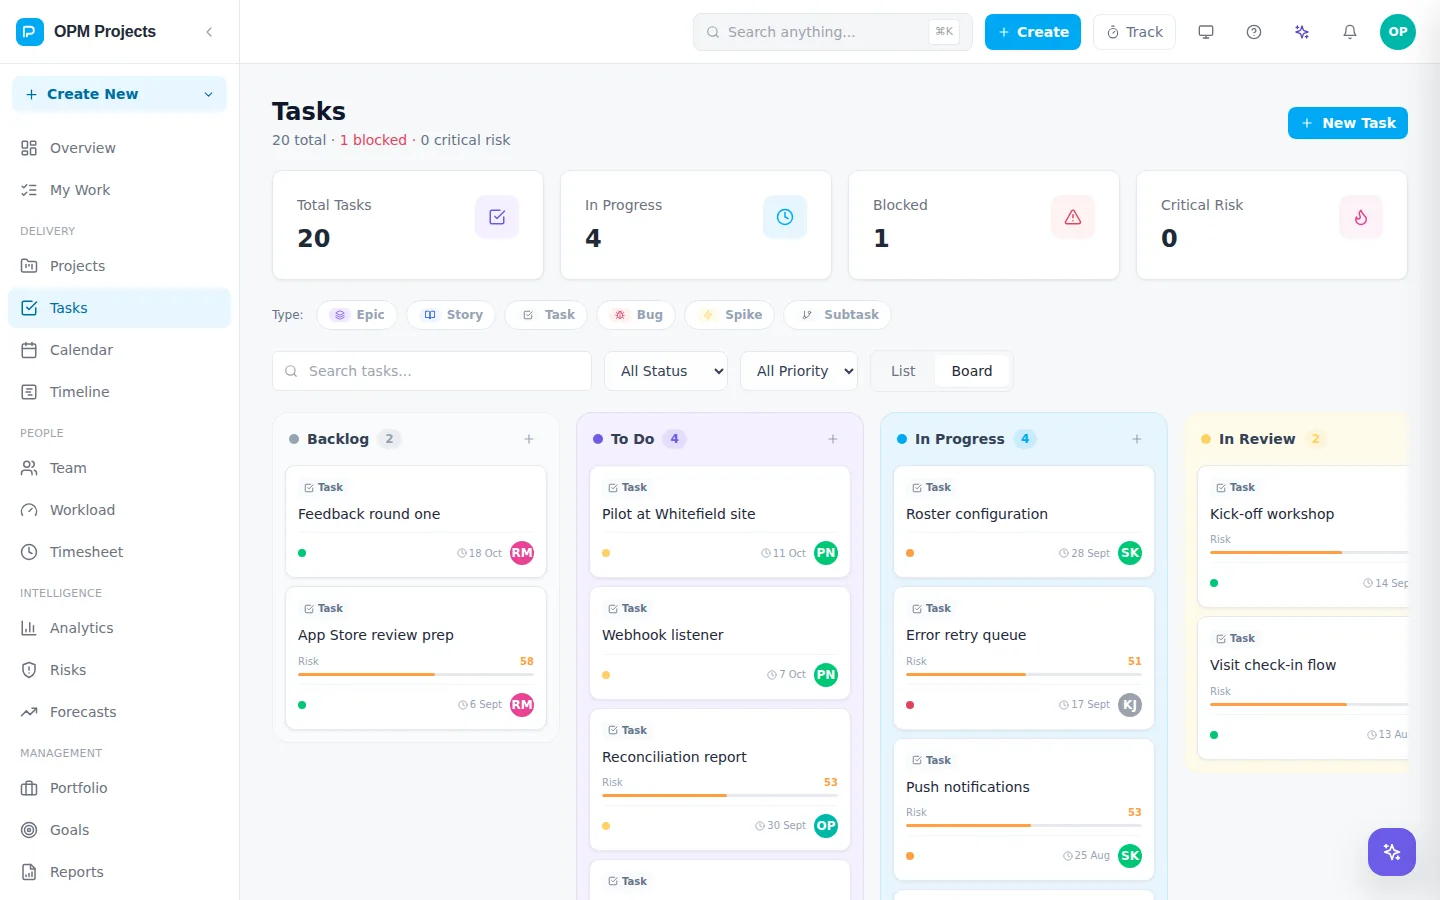
Work by status
Move tasks across a board your team updates as they go.
- Board and list views
- Priorities and owners
- Blocked work stands out
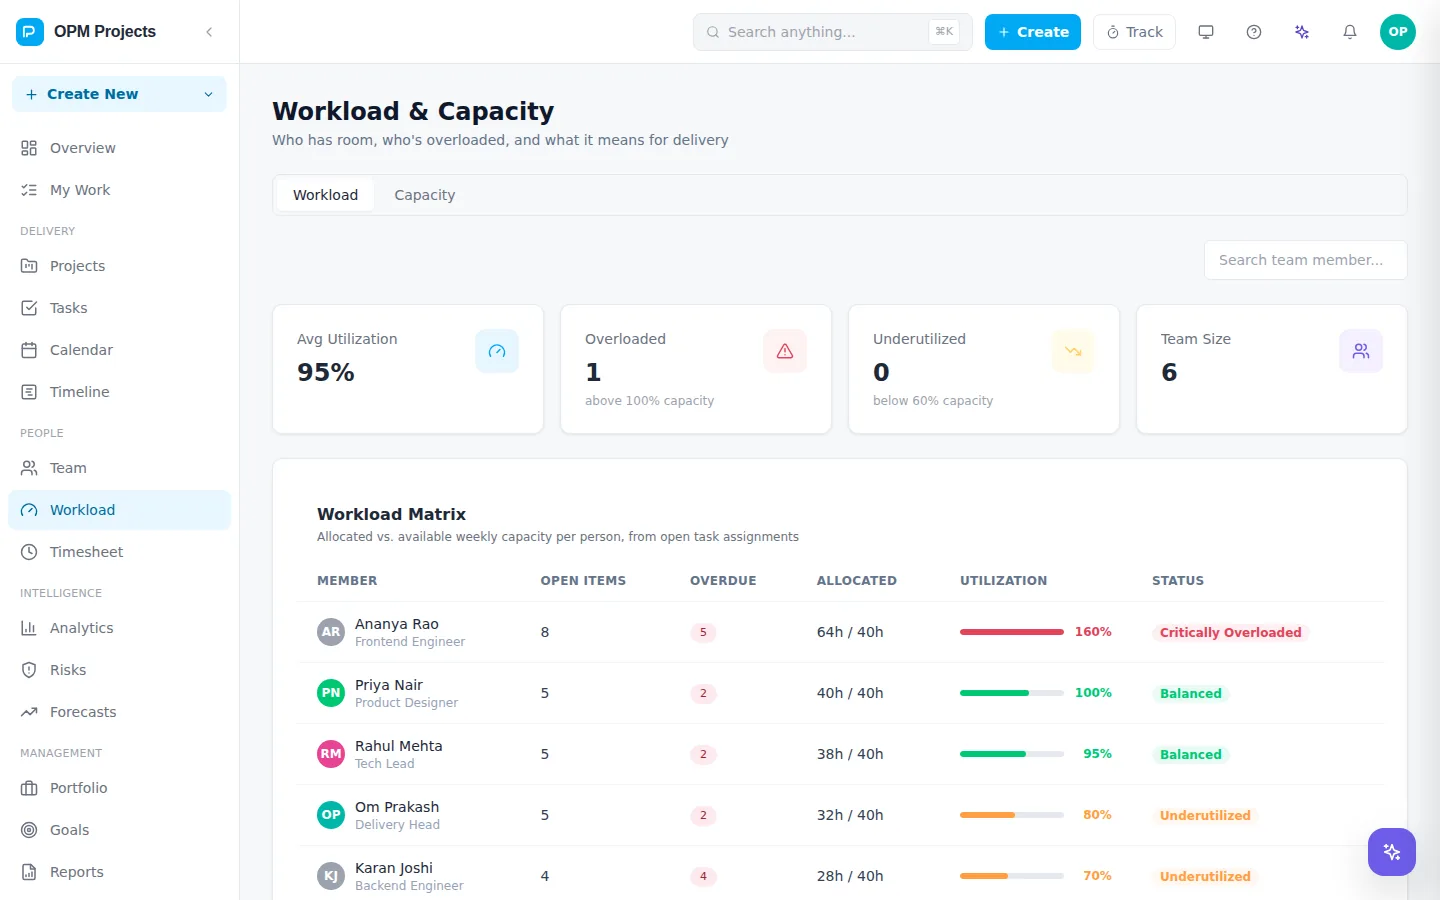
People and capacity
Who is on which project, and how much they have on.
- Team directory
- Allocation by person
- Workload by week
Reports for the Monday meeting
Progress, time and delivery reports without building a spreadsheet.
- Project and portfolio reports
- Time reports
- Goal progress
Built for
For the people who make delivery happen.

Project and delivery managers
Plans, dates and risks in one place, and a forecast you can defend.
See how
Day to day
Simple for the people doing the work.
Tasks sit on a board or in a list. My Work collects each person’s tasks from every project, and the calendar shows what is due. Nobody needs a manual.
- Board and list views
- My Work across projects
- Calendar of deadlines
To do
Content migration plan
In progress
Checkout redesign
API rate limits
In review
Release notes v2.4
Part of OPM Technologies
Delivery connected to the rest of the business.
One OPM company account and one sign-in across products. Connections are rolling out product by product.
 Planned
Won deals to projects
Start a project plan from a signed deal in OPM CRM.
Explore CRM Planned
Real capacity
Teams, leave and roles from OPM Workforce for resource planning.
Explore Workforce Planned
Milestones to invoices
Bill completed milestones and logged time through OPM Billing.
Explore Billing
Questions
Good to know
What makes OPM Projects different from a task tracker?
Alongside tasks, boards and timelines, it forecasts when a project will really finish, with a likely date and a near-certain date, and shows workload and risks across every project.
How does the delivery forecast work?
It runs many simulations from your remaining work and your team’s pace, then shows the date you will likely finish by (P50) and the date you are almost sure to finish by (P90).
Can we track time?
Yes. People log time against tasks in timesheets, and the time feeds workload and reports.
Can we see all projects at once?
Yes. The timeline, portfolio and goals views show every project’s window, progress and risk together.
How is OPM Projects priced?
Per user, per month. Public prices are being finalised, so we quote based on your team size and plan.
See your next project forecast.
A 30-minute walkthrough of timelines, workload and forecasts, set up around one of your real projects.